數字,說明一切
0+
累計學生
0%
頂標達成率
0+
教學年資
0%
課程好評率
選擇你的學習階段
從高一到大一銜接,找到最適合你的課程
找不到適合的課程?立即諮詢
榮譽榜
雄中
莊景皓
台大電機
另外正取台大資工/台大物理
嘉女
蘇于雯
台大法律財法組
嘉中
張淵荏
台大醫科
嘉華中學
呂政儒
陽明交大醫學系
嘉中
林輝陽
長庚醫學系
南一中
楊秉嶧
台大電機
雄中
潘祐君
台大醫科
雄中
紀宗凱
台大電機
北一女
劉蘋萱
北京清華大學
雄女
郭宥真
台大資工
另外正取台大電機
雄中
莊景皓
台大電機
另外正取台大資工/台大物理
嘉女
蘇于雯
台大法律財法組
嘉中
張淵荏
台大醫科
嘉華中學
呂政儒
陽明交大醫學系
嘉中
林輝陽
長庚醫學系
南一中
楊秉嶧
台大電機
雄中
潘祐君
台大醫科
雄中
紀宗凱
台大電機
北一女
劉蘋萱
北京清華大學
雄女
郭宥真
台大資工
另外正取台大電機
為什麼選擇莊小寬
不只是補習,是重新愛上數學的起點
🕐
學習時間自由
影片課程隨時可看,配合你的作息,不受時間地點限制,反覆觀看直到完全理解。
🧠
邏輯建構教學
不靠死背公式,從原理出發重構數學邏輯,讓你真正理解數學的美與規律。
🏆
頂大錄取實績
每年超過 1/3 學員考取頂尖大學,台大、陽明醫學系等頂尖校系遍佈榮譽榜。
📚
完整課程體系
從高一到大一銜接,六冊完整覆蓋,一位老師陪你走完整個高中數學旅程。
💬
即時問題解答
購課學員享有 LINE 直接提問服務,學習卡關不孤單,老師親自解惑。
準備好開始你的數學之旅了嗎?
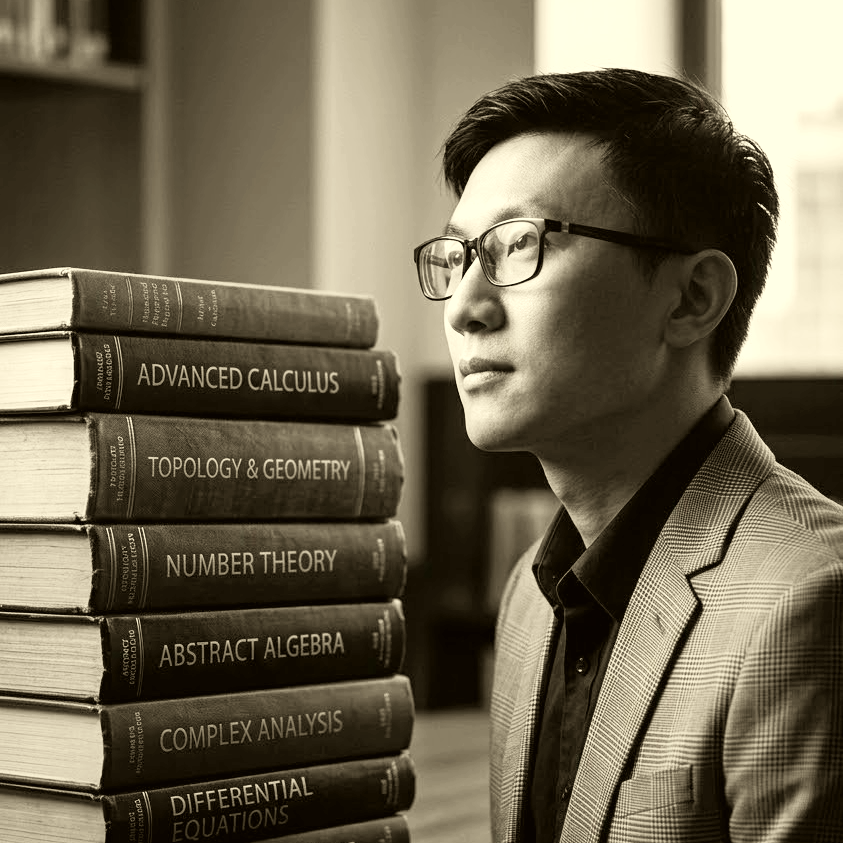
關於老師
莊小寬 老師
教數學是幸福,讓學生愛上數學是奢侈的幸福
學經歷
智商162,以全國第二名進入建國中學,建中奧林匹克代表隊成員,交通大學應用數學系,交通大學應用數學研究所分析組。
專精領域橫跨分析與離散,莊小寬數學創辦人。 小寬老師一出道便以專業的數學語言與獨特的邏輯席捲市場,掀起一陣莊小寬旋風。 上課幽默風趣卻又條理分明,讓他成為學生眼中獨一無二的數學好朋友。